¶ Chart Overview
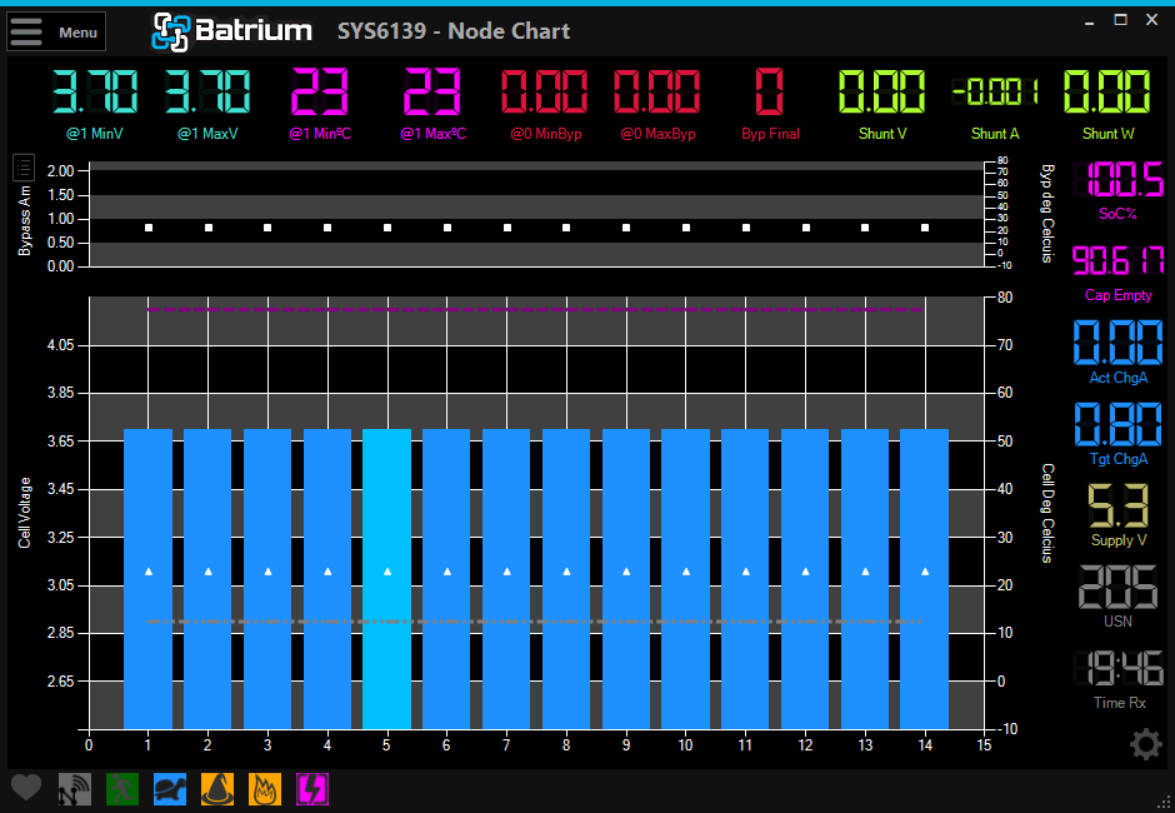
The Node Chart is a live visual representation of how your system is performing. It is customisable so as to allow you to see the things most important to you.

¶ Status Icon
Appears at the bottom of the screen and shows you the overall condition of your system and the most important warnings.
![]()
¶ Status Icon Definition
If you hover your curser over the icon you will see a Support Tip as to what it means.
![]()
¶ Parts of the Chart
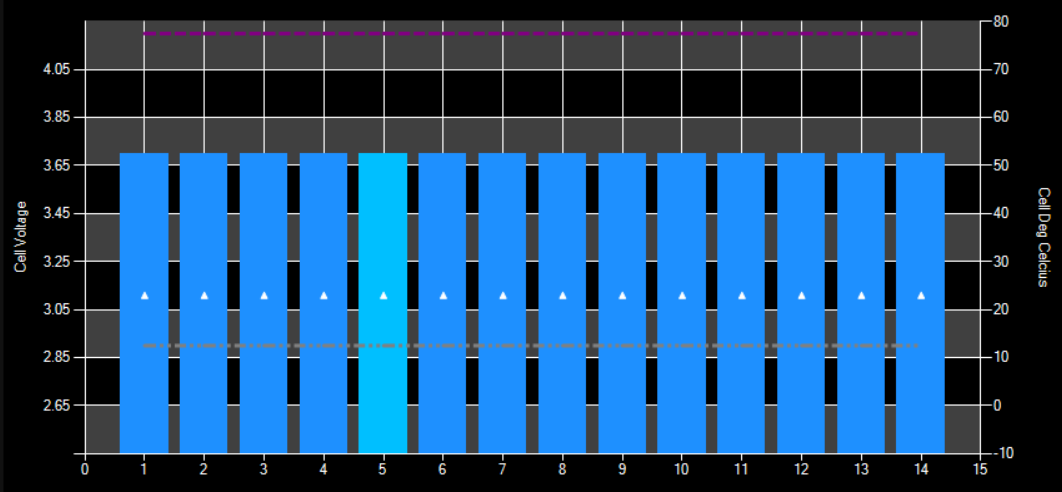
¶ Cell Chart

¶ Bypass Chart

¶ Top Digit

¶ Right Digit

¶ Settings
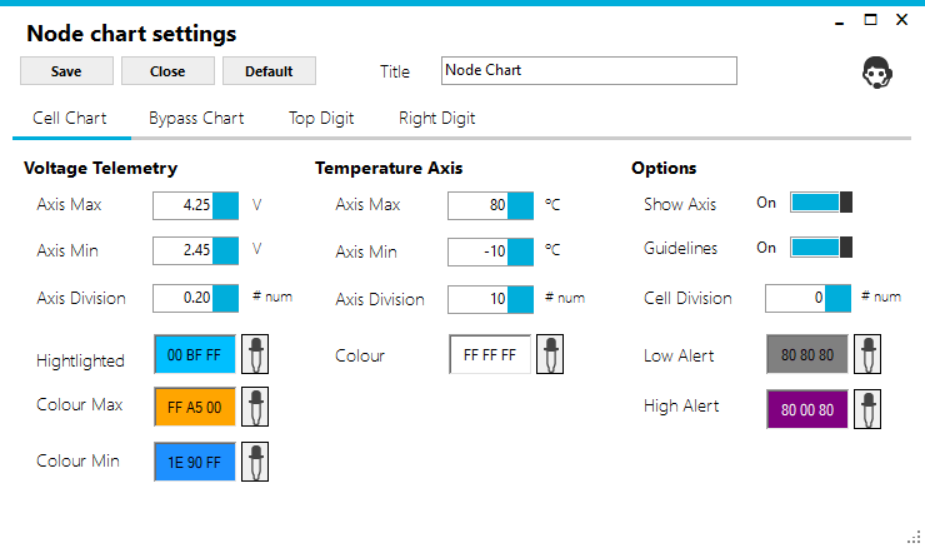
At the bottom right corner of the node chart there is a settings button that allows you to customise your Node chart.
There are 4 parts of the Node Chart you can customise: The Cell Chart, Bypass Chart, Top Digits or Right Digits.

